PROCESSED OMICS DATA · R SHINY

OmicPrism

Visualize data.
Explore biological patterns.

A graphical workbench for exploratory visualization and functional interpretation of processed omics data.

Developed and demonstrated with human and murine proteomics datasets.

THE APPLICATION

Start your analysis.

Open OmicPrism in your browser. Analysis tools, input examples and export options are available inside the app.

Applications

Proteomics examples used in the accompanying manuscript.

Download figures

TIME-COURSE PROTEOMICS

Follow coordinated protein profiles.

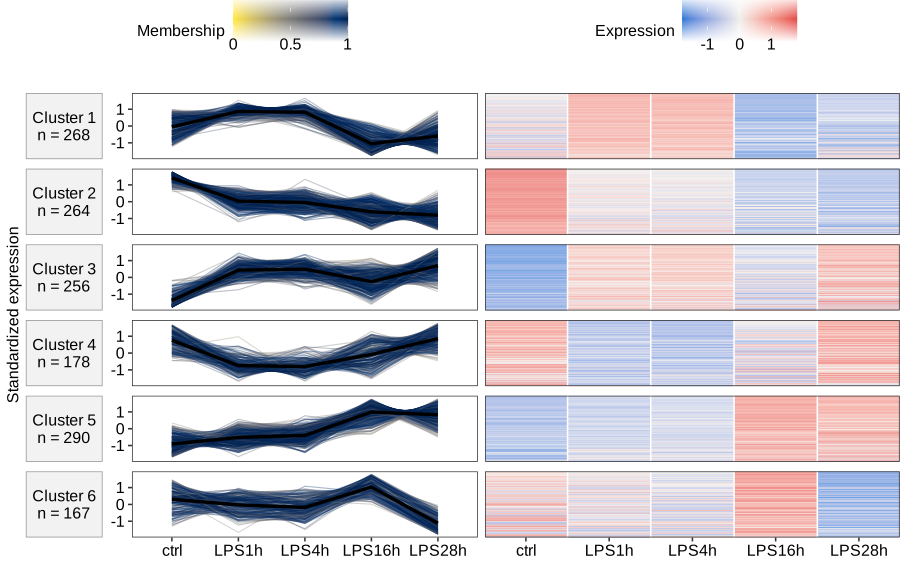
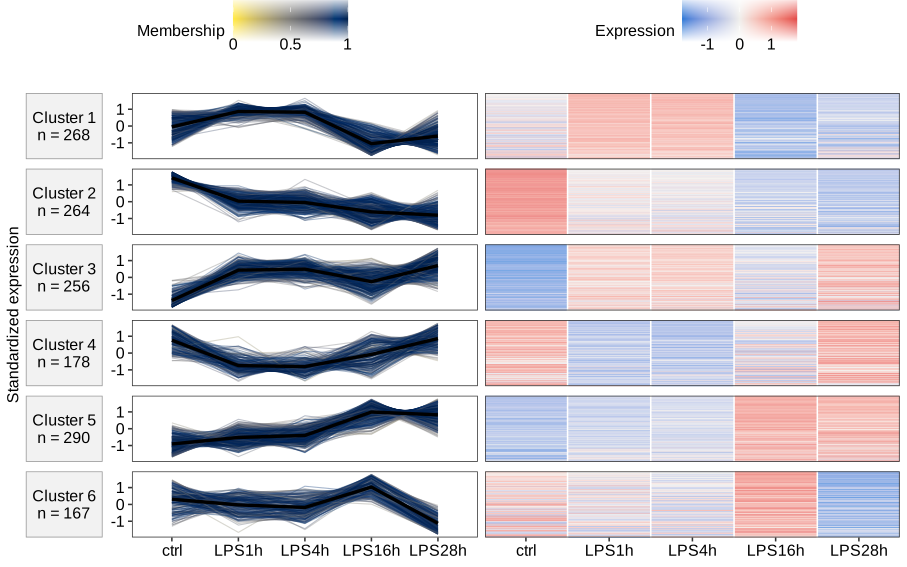
Explore fuzzy clusters across an ordered LPS time course, with membership-colored profiles aligned to expression heatmaps.

Control · LPS 1 h, 4 h, 16 h and 28 h

Six Mfuzz clusters with protein profiles on the left and aligned expression heatmaps on the right, across control and four LPS time points. View full figure
Mfuzz cluster profiles and heatmaps.Download SVG

HUMAN PROTEOMICS

Inspect differential abundance.

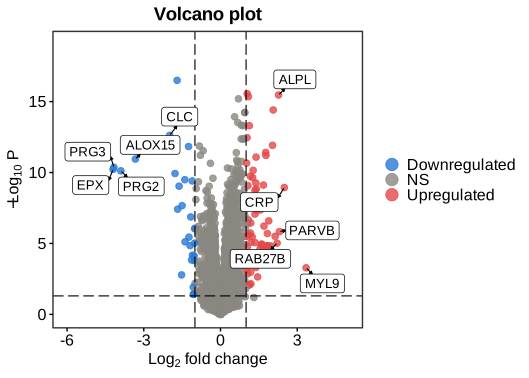
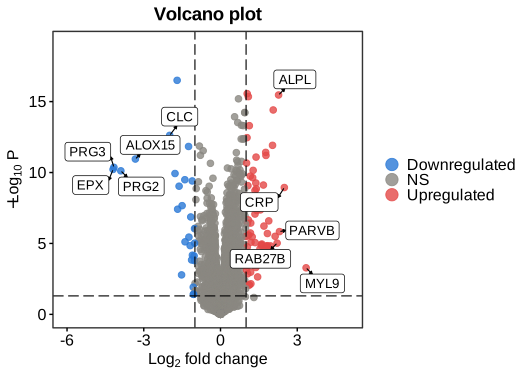
View fold changes and statistical significance together, with selected proteins labeled for closer inspection.

Volcano plot · processed differential results

Volcano plot of log2 fold change against negative log10 P, with downregulated, nonsignificant and upregulated proteins and selected protein labels. View full figure
Volcano plot.Download SVG

EXPRESSION PATTERNS

Explore abundance across samples.

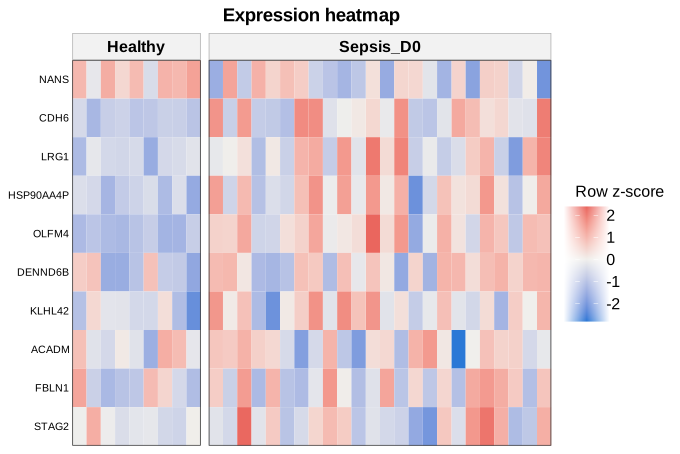
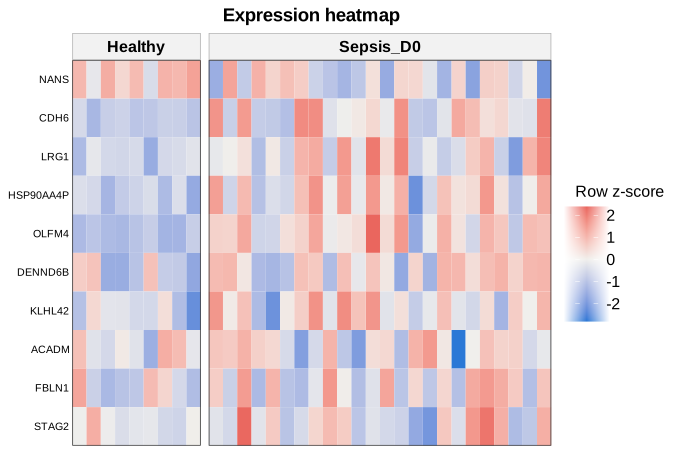
Inspect selected protein patterns in healthy and sepsis samples, displayed as row z-scores.

Healthy · Sepsis D0

IMMUNE-CELL PROTEOMICS

Explore sample-level pathway scores.

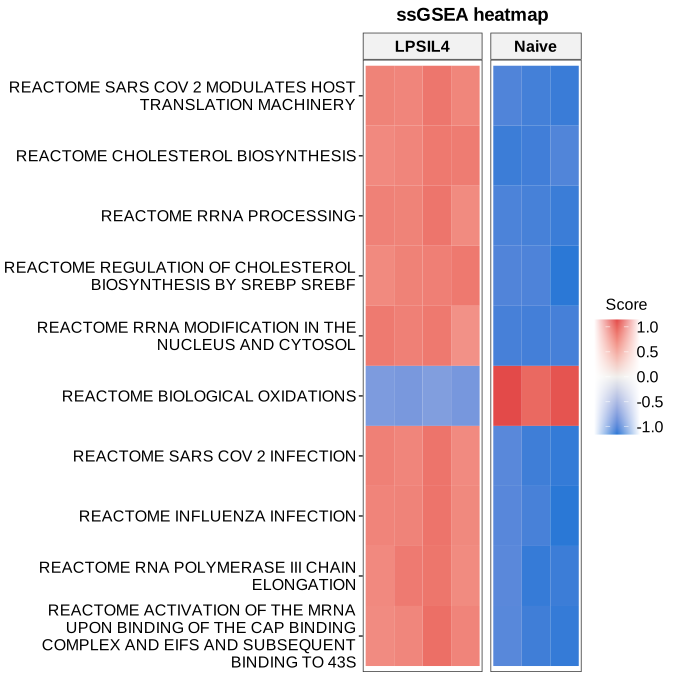
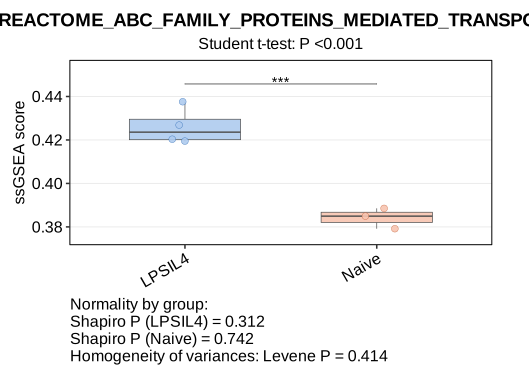
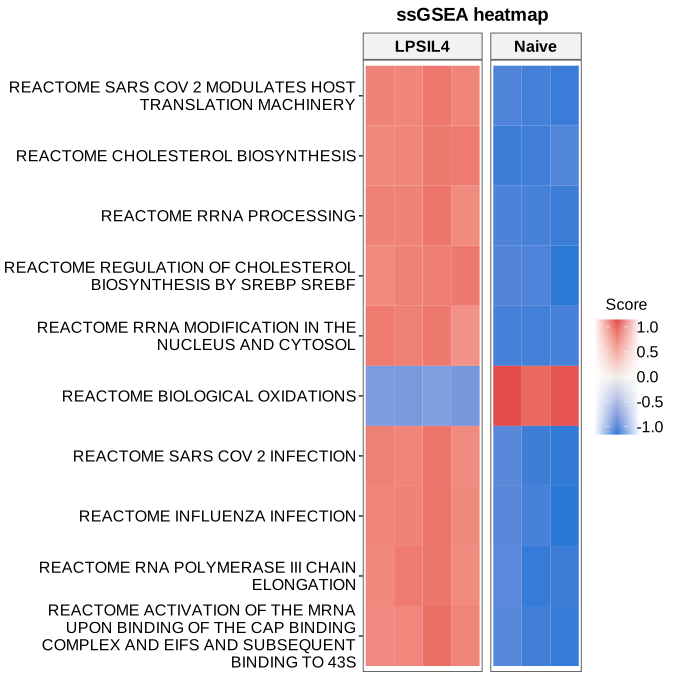
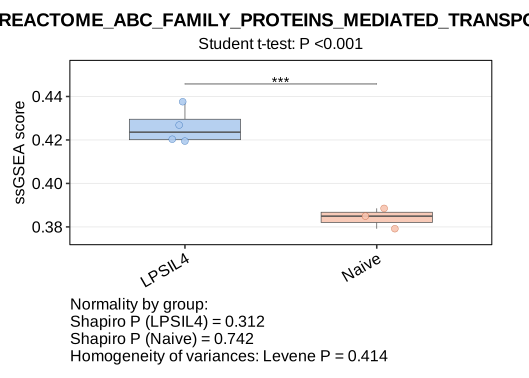
View gene-set score patterns and a selected pathway comparison in naïve B cells and B cells stimulated with LPS and IL-4.

Naïve · LPS + IL-4

GENE-SET INTERPRETATION

Compare enrichment patterns.

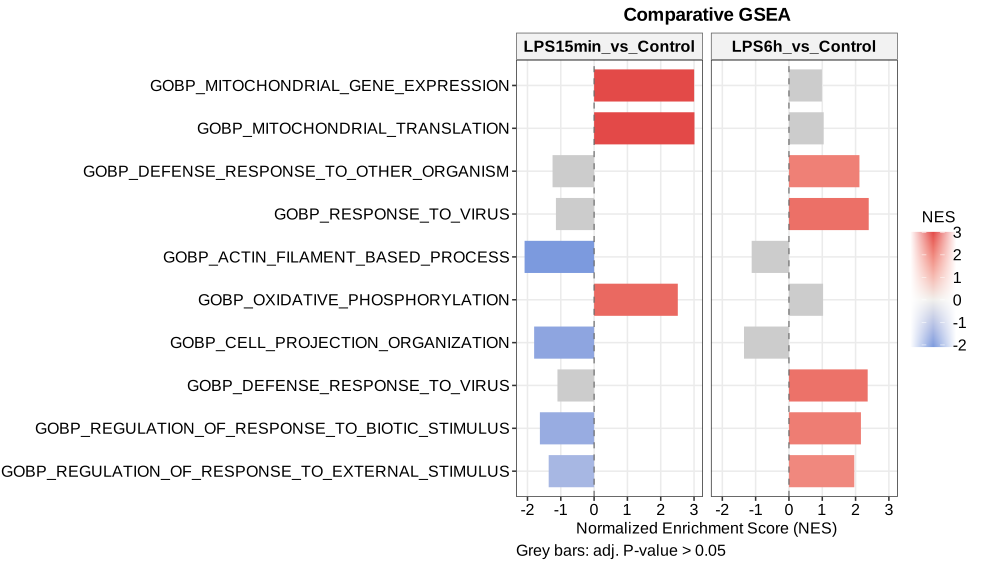
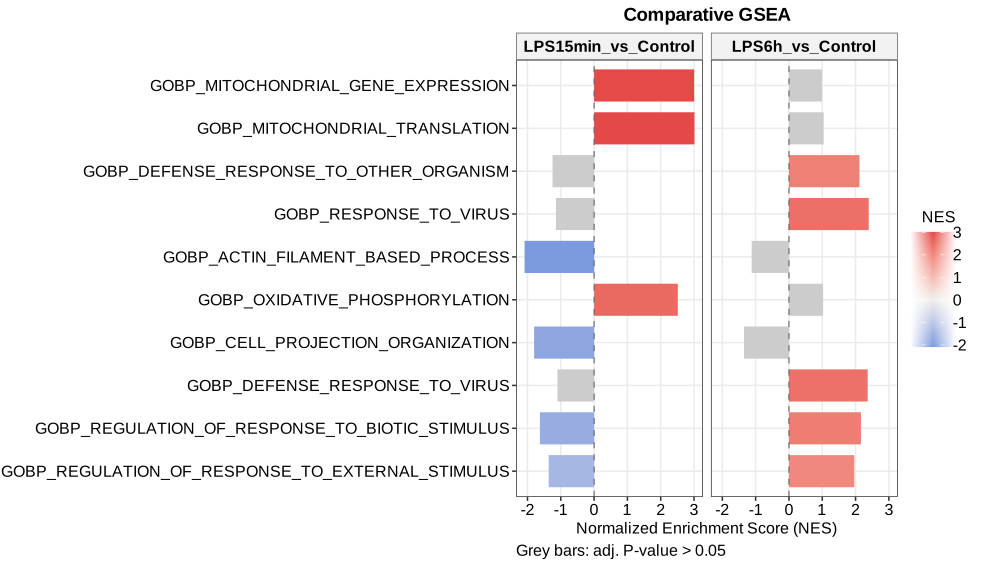
View normalized enrichment scores from two separately analyzed contrasts side by side.

LPS 15 min vs control · LPS 6 h vs control

Comparative GSEA bar plots showing normalized enrichment scores for ten GO biological process gene sets in LPS 15-minute and 6-hour contrasts against control. Gray bars indicate adjusted P greater than 0.05. View full figure
Comparative GSEA.Download SVG

THE RESEARCH

Article

Methods and scientific context.

Manuscript in preparation

OmicPrism: a modular Shiny application for post-analysis visualization and functional interpretation of omics data

Pedro Henrique Fogaça Jordão · Eduardo Moraes Reis · Giuseppe G. F. Leite

The manuscript describes the implementation of OmicPrism and its application to processed proteomics datasets.

The article link will be added when available.

Manuscript example

Original SVG example from the accompanying manuscript.

Download SVG